


The Rise and Fall of Sea Level
The Rise and Fall of Sea Level
During ice ages of the past, sea level was significantly lowered, and when that ice melted, sea level dramatically rose.

On January 13, 2024, a large (but definitely not unprecedented) storm system traversed the eastern U.S. and passed over the state of Maine. The storm caused a surge in local sea level that inundated coastal areas, including Portland and Bar Harbor. While Portland recorded its 3rd highest water level on record, Bar Harbor broke its prior record by half a foot.
Here are some photos of the Portland, Maine flooding, courtesy of Maine Public Radio.

Canoeing through the Customs House Wharf area of Portland, Maine, January 13, 2024. [Photo courtesy of Maine Public Radio, photo by Carol Bousquet]

U.S. 1 through Lincolnville Beach, Maine, January 13, 2024. [Photo courtesy of Maine Public Radio, photo by Kevin Millet]

Rockland Harbor, Maine, January 13, 2024 [Photo courtesy of Maine Public Radio, photo by Keith Shortall]
The photos above are what I call the “early year’s photos” of sea level rise. These images, of people kayaking or canoeing through urban streets or entire buildings falling into the ocean, will become increasingly common as time marches on and sea level continues to rise. Currently, NASA measures the rate of sea level rise at 3.4 millimeters (0.13 inches) per year. Since 1995, sea level has risen by about 4 inches. That is actually quite a lot, when even an inch of rise coupled with a big storm system can be the difference in significant inland flooding or not.
To understand sea level in full, we need to look to the past. Here are two of my favorite scientific methods for reconstructing sea-level heights going back 100s of thousands of years:
Coral Reef Highstands and Lowstands: Coral reefs grow in shallow water with lots of sunlight filtering through the water column. When we find corals that exist above current sea level, such as sitting on a hillside on some tropical island, we know that sea levels were once much higher to allow the coral to have grown there; this is known as a highstand. Similarly, if we dive down in the ocean far below where sunlight filters through, and far below where a coral reef could survive today, and we find ancient coral reefs there, we know that sea level was once much lower; this is known as a lowstand. Then, we can use scientific dating methods on the highstand or lowstand corals to assign an age, allowing us to reconstruct past sea-level heights.
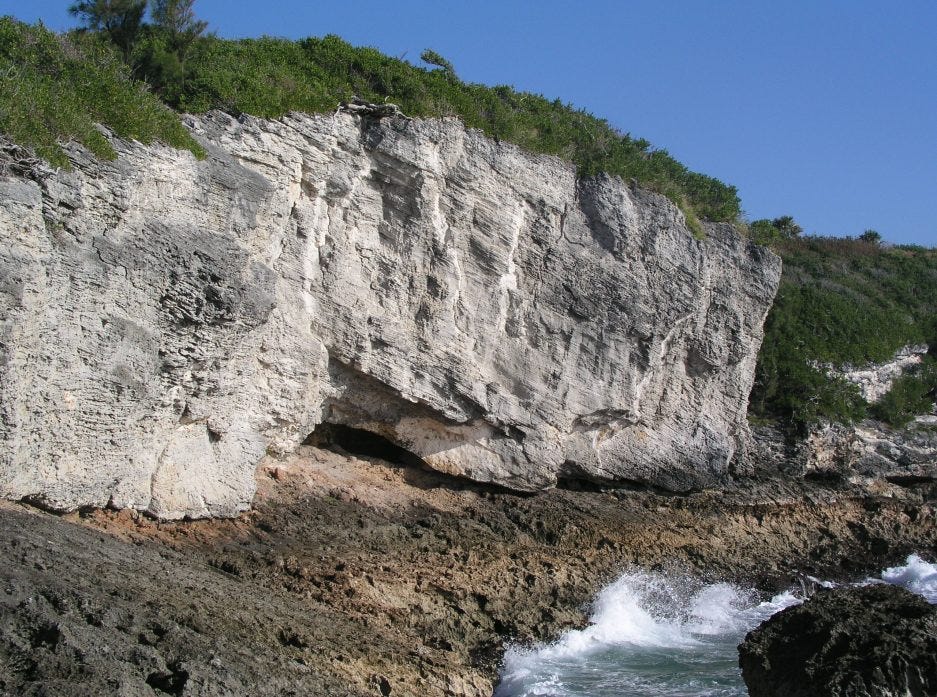
Watch Hill Park, Bermuda has coral-reef highstand features well above modern sea level. [Source: Bermuda Geology, Image Rights Unknown]

Fossil marine molluscs at Watch Hill Park, Bermuda, which would have lived in the inter-tidal zone on a rocky shore. The molluscs sit at 6.0 to 6.5 meters (19.7 to 21.3 feet) above modern sea level, with an approximate age of 200,000 years or so before present, suggesting sea level at this time was at least 19 feet higher. [Source: Bermuda Geology, Image Rights Unknown]
Benthic Foraminifera: Foraminifera ( or "forams" for short) are single-celled organisms with a streaming granular ectoplasm (note: see more on ectoplasm below) for catching food and an external shell (called a test) of varying types with beautiful patterns. Most foraminifera are marine-based, many of which live on or within seafloor sediments (benthic), while some float in the water column (planktonic). The key point is that the shells of these little organisms record forensic clues about sea level of the past. The full story requires its own newsletter post, but in short, the shells contain different types of oxygen molecules (known as isotopes, such as oxygen-16 or oxygen-18, the oxygen-18 having two extra neutrons than the oxygen-16), and the specific ratio of isotopes in benthic foram shells relates to land ice volume (rather amazingly). When ice sheets on land form, that water had to come from somewhere, and it mostly comes from the oceans. It turns out that land ice during cold periods of the past, like ice-ages, tends to have more oxygen-16, while the oceans end up with more oxygen-18. When land ice melts, the extra oxygen-16 returns to the oceans. While land ice grows or shrinks over long periods of time, the little forams absorb oxygen isotopes from ocean water to build their shells. When the forams die, they end up in a layer of ocean sediment that corresponds to a specific time period. Scientists use deep sea drilling to recover these ocean sediments, date the layers to a specific age in the past, and then measure the oxygen-isotopic content of the foram shells in each layer, which tells us how much land ice was present on Earth. Note: there are some complicating factors that affect the shells isotopic signature, such as water temperature, which scientists make a correction for, as discussed in this famous paper by N. J. Shackleton.

Phase-contrast photomicrograph of a live Ammonia tepida benthic foraminifera, collected from San Francisco Bay. [Wikipedia, CC BY 2.5, Scott Fay, UC Berkeley, 2005]

Beautiful benthic foraminifera fossils (see more here). (Top Left) Nodosaria sp., Jurassic period, Villers sur Mer, Normandy, France, scanning electron microscope (SEM). (Top Right) Spiroloculina ornata (d'Orbigny), modern, Sea of Marmaraside, SEM. (Bottom Left) Elphidium macellum (Fichtel and Moll), modern, Sea of Marmaraside, SEM. (Bottom Right) Lagena striata (d'Orbigny), modern, Sea of Marmaraside, SEM. [Source: Microfossil Image Recovery and Circulation for Learning and Education]
Ok, let’s step back briefly and talk about some popular culture. So this word “ectoplasm”, as in the “streaming granular ectoplasm for catching food” of foraminifera that I mentioned above - I immediately thought of Ghostbusters! In the original movie, parapsychologists (the fancy word for a ghostbuster) referred to the oozy goo emitted by ghosts as ectoplasm, or more simply “slime”. The green and voraciously-hungry ghost “Slimer” left ectoplasm all over Bill Murray’s character Peter Venkman, as shown by the screen grabs below. Did Dan Aykroyd, who wrote the Ghostbuster movie script, lift the term “ectoplasm” from our foraminifera friends? I hope someday the truth comes out. But, the more I write about science, the more I realize how much science is deeply entwined with popular culture. Cool stuff!


Screen grabs from Ghostbusters (1984) showing Peter Venkman (Bill Murray) covered in ectoplasm after the ghost Slimer flew directly through his body. [Fair Use]
So, what do sea level reconstructions show us? Below, I plot sea level for the last 435,000 years, based upon benthic foraminifera oxygen-isotope reconstructions. You will notice that sea level rises and falls in a somewhat repeating pattern roughly every 100,000 years - like a rollercoaster - reaching an extreme minimum of about 120-130 meters (393-427 feet) below modern sea level and an extreme maximum of about 6.5 meters (21.3 feet) above modern sea level.
A record of relative sea level (meters) derived from oxygen-isotope analysis of benthic foraminifera shells in ocean sediment cores (North Atlantic, South Indian, and Equatorial Pacific Oceans). Modern day sea level is set to a value of 0 meters (dashed line). The pattern of the record is a bit reminiscent of a sea-level rollercoaster ride through time. [data: NOAA from Waelbroeck et al,. 2002; plot: Tyler R. Jones, CC BY 4.0]
During the Last Glacial Maximum (LGM) 20,000 years ago, sea level was 123 meters (404 feet) lower. This exposed the continental shelves, creating vast amounts of new coastal land areas (see maps below). There are many interesting features of such low sea level, including two of my favorites that relate to past human migration. 1) The exposure of the Bering Land Bridge between what is modern day Alaska and northeast Russia. The land bridge allowed our human ancestors to walk from Asia into North America and eventually South America. 2) It was also possible to walk from what is present day France into the United Kingdom. Who knew humans would one day build a tunnel between France and the U.K. when sea levels rose!

Map of inferred sea level during the Last Glacial Maximum (LGM) showing the exposure of the Bering Land Bridge, used as a migration route by our ancestors. [USGS, Public Domain]

Europe during the Last Glacial Maximum, including a land connection between France and the United Kingdom. White areas are ice sheets and ice caps. [Wikipedia, CC BY-SA 3.0, Ulamm]
During prior warm periods, such as 125,000 years ago during the Eemian Period, sea level was up to 6.5 meters (21.3 feet) higher. If that amount of sea-level rise were realized today, most of the coastal cities in the world would be fully flooded, like Miami, New York, London, Bangkok, Amsterdam, Dubai, Hamberg (Germany), Shenzhen (China), and many more. Since the Eemian had similar temperatures to modern climate, this is a line of evidence that suggests modern sea level will continue to rise for the foreseeable future as the Earth system seeks to equilibrate to higher greenhouse gases and rising temperatures.
There is a correlation between temperature, greenhouse gases, and sea level through time, which I consider one of the most interesting aspects of paleoclimate science. In the figure below, when temperature and greenhouse gases are low during an ice age, sea level is also low. But why? The main reason is that as temperatures lower in the Northern Hemisphere entering into an ice age, there is a critical threshold reached where summer temperatures around 65°North latitude (such as near Fairbanks, Alaska) are not sufficient to melt the prior winter snows. As successive years pass, and then decades and centuries, the snow that does not melt in summer starts to build up, layer after layer, eventually becoming very heavy, compressing layers below into ice. This is the start of the great ice sheets. Over thousands and thousands of years, enough ice accumulates to create the multi-mile high behemoth ice sheets that covered much of the Northern Hemisphere, such as the Laurentide Ice Sheet in the Last Glacial Period. Whereas it tends to take a long time to build an ice sheet (many 10s of thousands of years), ice sheets can rapidly melt in only a few thousand years. (Note: be sure to check out prior Paleoclimate newsletters about The Ice Ages and Variations in Greenhouse Gases).
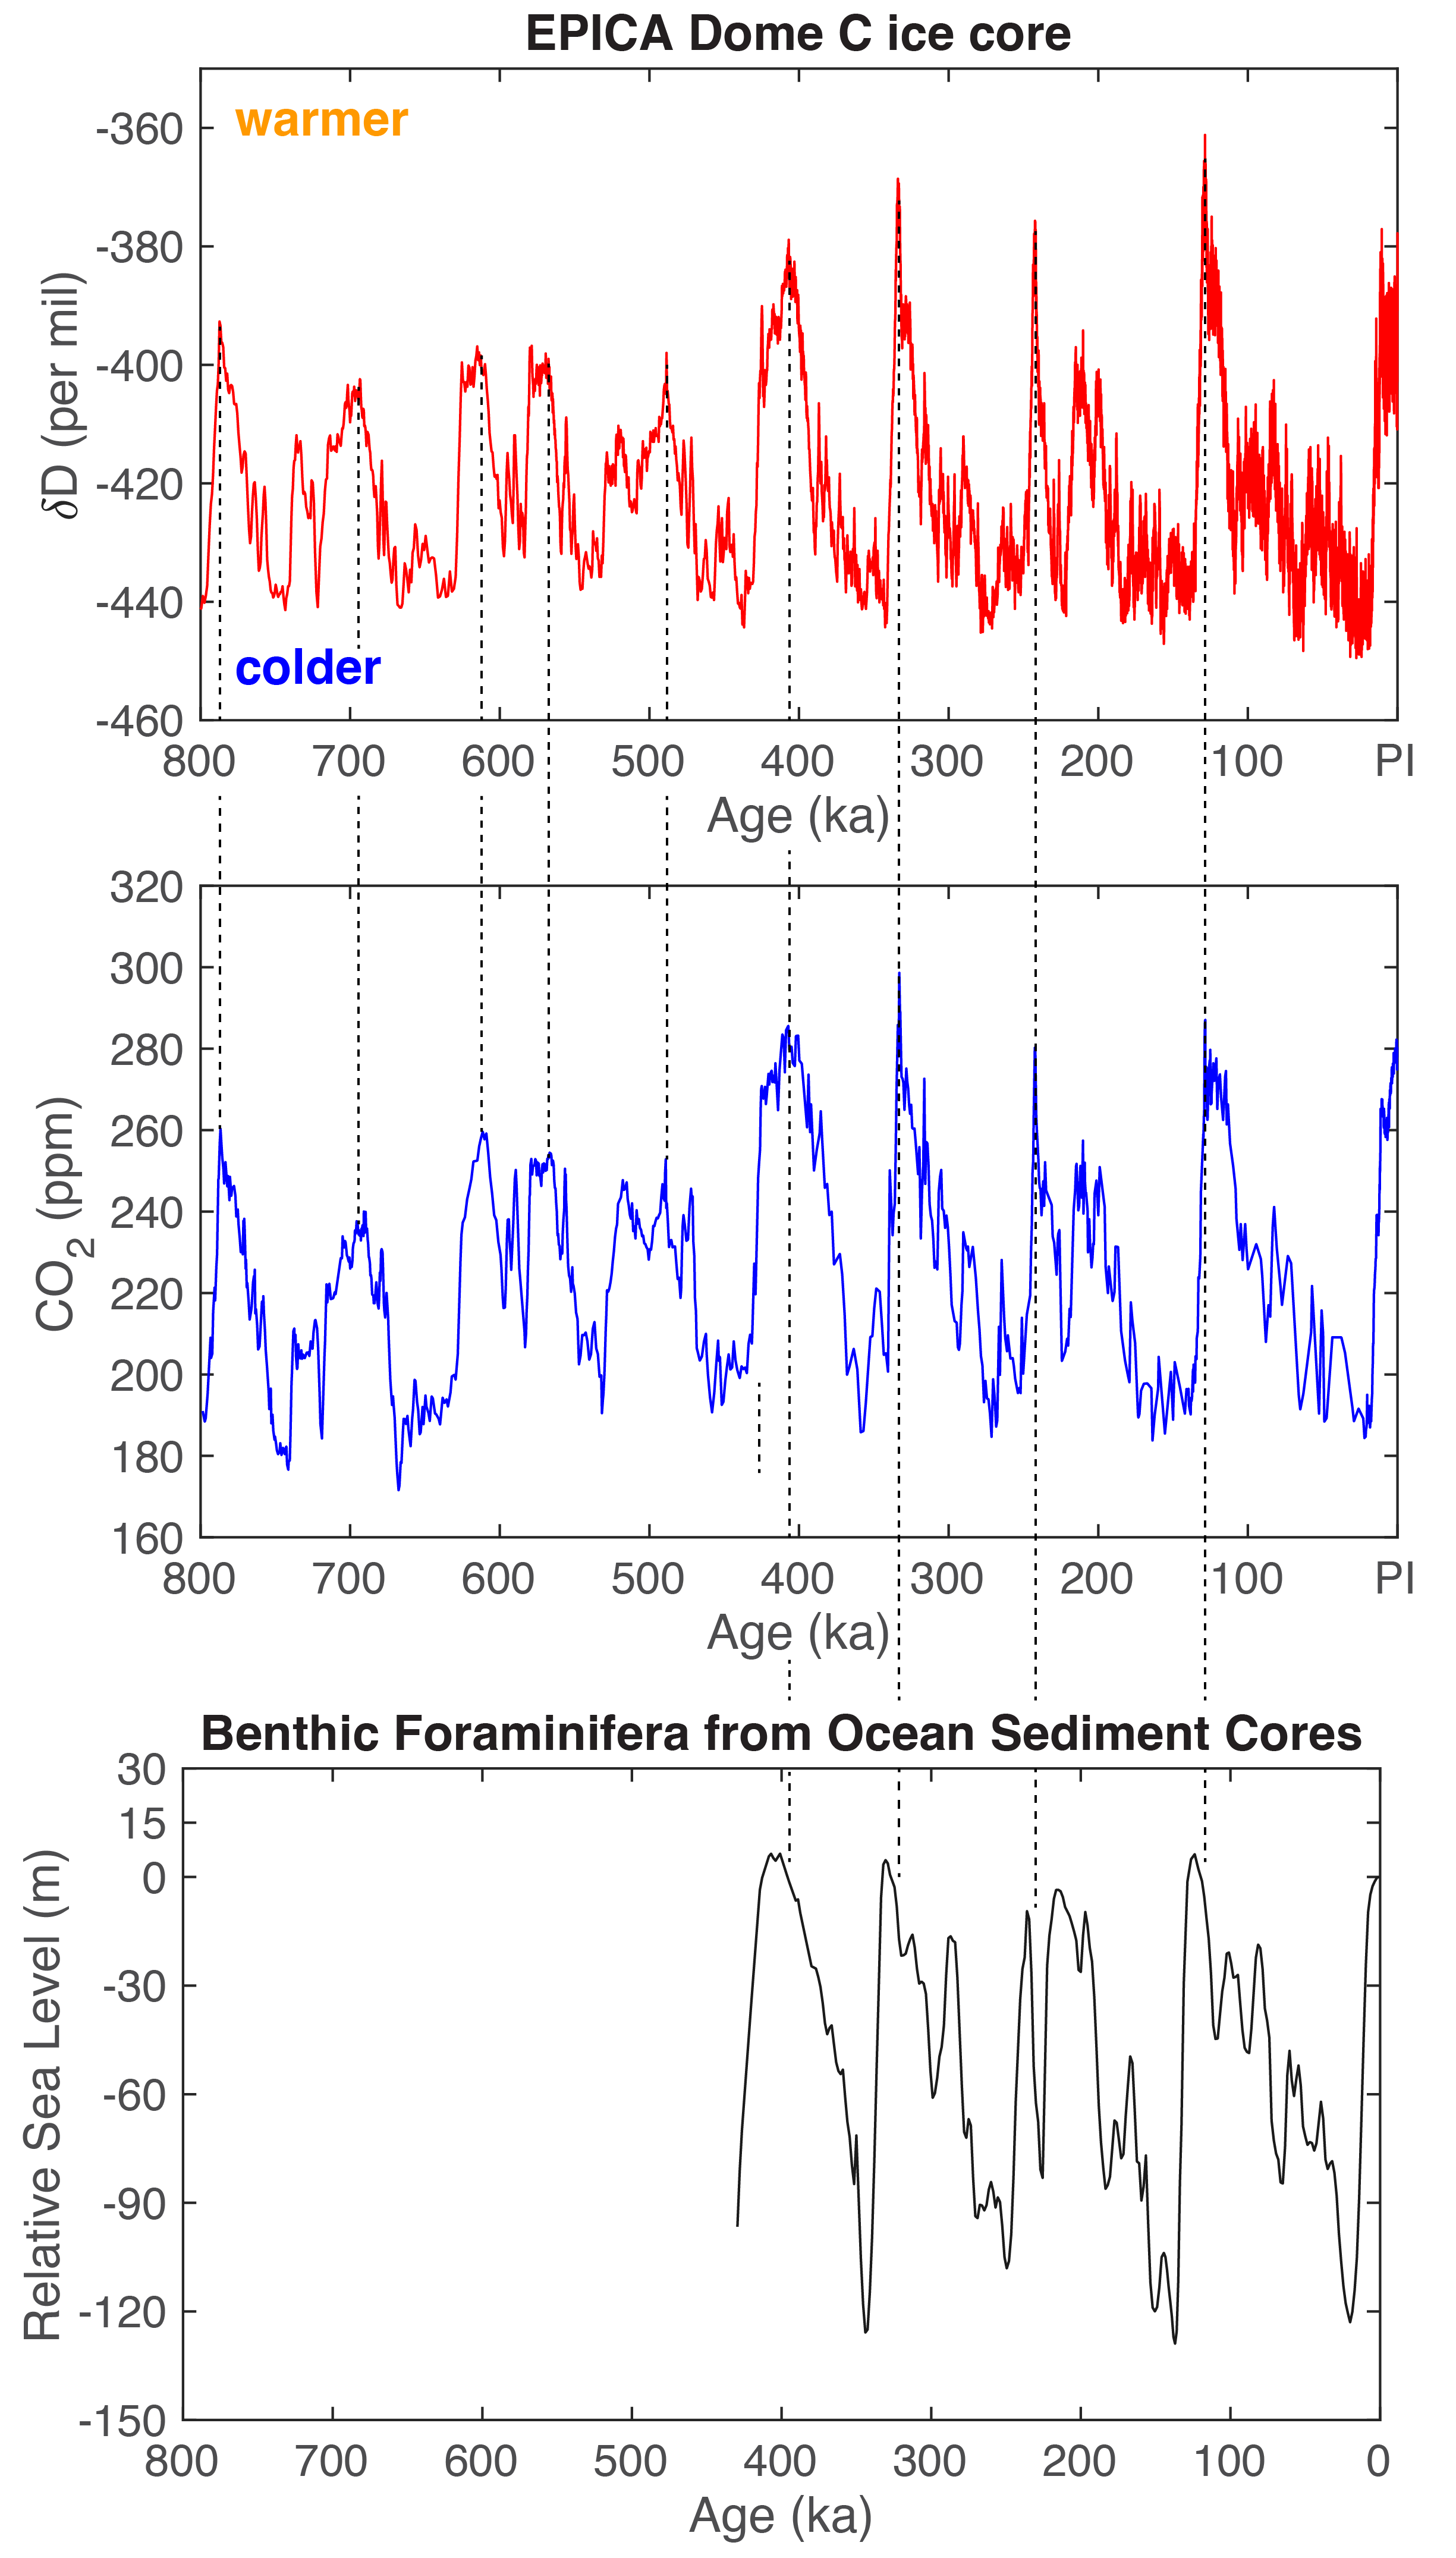
The correlation between temperature, carbon dioxide (a greenhouse gas), and sea level through time. (Top) A record of hydrogen isotopes (δD) from the EPICA Dome C ice core. The δD measurement can be considered a proxy for local temperature. (Middle) The record of carbon dioxide (CO₂) from the EPICA Dome C ice core. (Bottom) A record of relative sea level (meters) derived from oxygen-isotope analysis of benthic foraminifera shells in ocean sediment cores. [data top: Pangaea; data middle: NOAA; data bottom: NOAA from Waelbroeck et al,. 2002; plot: Tyler R. Jones, CC BY 4.0]
So, you might be wondering how sea level will affect our modern world? In a 2019 report, the Intergovernmental Panel on Climate Change (IPCC) projected 0.6 to 1.1 meters (1 to 3 feet) of global sea level rise by 2100 (about 15 millimeters per year), if greenhouse gas emissions remain high. So, in that case, there will be large portions of coastal cities that flood. If you asked me how I think it will play out, first, things like king tides or storms will cause progressively more and more coastal flooding that damages properties. Flooding in Miami, for example, is already commonplace.

Tidal flooding during the king tides in Brickell, Miami, October 17, 2016. [Wikipedia, CC BY-SA 4.0, B137]
Eventually, insurance agencies will decide it is too risky to ensure property near the ocean. Then, without insurance, real estate markets will start to fail, and people will not be able to sell their homes. The homes and properties will eventually be abandoned. As sea level rises higher, some structures might be removed by local, state, or federal authorities for safety reasons, but others will simply just fall into the ocean (as happened in Maine recently). The important thing to know is that while a coastal property may not have any flooding for many, many decades, the property value could still plummet if insurance agencies decide that the risk to insure is too great. Without insurance, it is very hard to sell a home. Be careful with property on the coasts!
Ok, that’s it. Thanks for reading. And please support this newsletter with a paid subscription. Pricing is currently set as low as Substack will allow.
Sincerely,
TRJ, PaleoClimate Scientist
Fire or ice? World desert or world wetlands? So many possible futures. What's our best guess at the moment? If we average the ensemble of mediulm range climate predictions what does the world a century from now look like?